
Introduction
Designs that maximize our performance are often NOT the ones we desire most. In other words, how we feel about a design is often a poor predictor of how well we’ll actually perform when using it. This is true for both the design of user interfaces and of learning environments for training purposes, such as medical simulation.
This disconnect between performance and preference creates challenges for people who create new products. In some cases, users gravitate toward familiar or aesthetically pleasing designs, even when they hinder effectiveness or efficiency. In others, learners may prefer training methods that feel easier, yet fail to deliver lasting results. These challenges highlight limitations of self-reported assessments of usability and underscore the value of understanding how users will actually perform.
This blog explores the performance vs. preference paradox across two domains: user interface design and the design of learning environments. It draws on examples such as the QWERTY and Dvorak keyboards, usability studies, and motor learning research.
Understanding Measures of Performance and Preference
Let’s first clarify what we mean by performance and preference in design contexts.
Performance refers to a behavioral act of executing a skill/task at a specific time and place. Key measures of performance might include task completion time, error rates, and overall success in achieving a goal. These metrics are objective and can be quantitatively evaluated.
Preference, on the other hand, relates to users’ subjective feelings about a design. This includes how enjoyable, intuitive, or visually appealing they find it. Measures of preference are typically gathered through Likert scale surveys, interviews, or other self-reported assessments that capture users’ perceptions and emotional responses.
The challenge arises because what users prefer does not always align with what enables them to perform optimally.
The Interface Design Paradox
One classic example of the disconnect between performance and preference is the comparison between the QWERTY and Dvorak keyboards. The QWERTY keyboard layout was originally designed to minimize typewriter jams, not to maximize typing speed or efficiency. Despite this, it remains the standard due to familiarity and widespread adoption. In contrast, the Dvorak keyboard was specifically designed to optimize typing efficiency and reduce finger movement, with studies showing that it can improve typing speed by 5% to over 30%. However, Dvorak has never gained the same popularity as QWERTY because people prefer the comfort of what they already know, even if it limits their performance.
A recent project we worked on provides another clear example of this performance vs. preference disconnect. We conducted A/B testing on two different score reports that included figures of data. Users unanimously preferred Score Report B because of its aesthetic design and the type of figure used. However, not a single user was able to successfully explain what Score Report B was representing. If we had relied solely on user preference without assessing their actual performance, we would have chosen a score report that failed to effectively convey information, despite its visual appeal and being the preferred option.
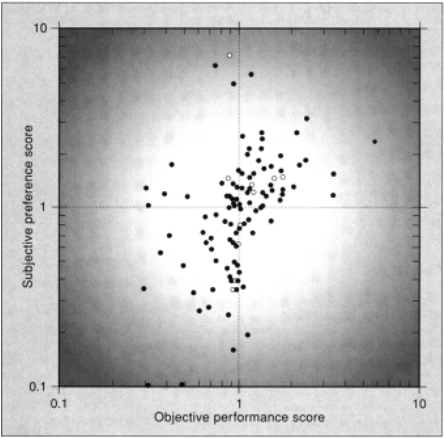
When this performance-preference gap has been scientifically studied, it is not uncommon to find that user preferences do not align with optimal performance outcomes. For example, Nielsen and Levy (1994) demonstrated that while there is a positive correlation between subjective preference and objective performance, there are still many cases where users prefer a design that is measurably worse for their performance. The figure from their study illustrates this point by showing how user ratings of preference do not always correspond with their ability to effectively complete tasks. Data points in the upper left or bottom right quadrants indicate instances where users preferred a design in which they actually performed worse, highlighting the disconnect between subjective preference and objective performance.
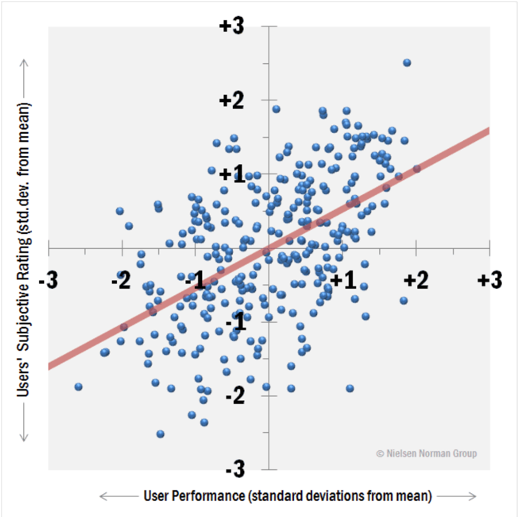
In a more recent investigation in 2012, the Nielsen Norman Group further expanded on this idea by comparing objective performance and subjective preference metrics across 298 designs. The figure from this study illustrates the relationship between user satisfaction and performance, with each dot representing a website, application, or intranet. The x-axis indicates user performance, while the y-axis represents user satisfaction. In line with the 1994 study, there was a positive correlation between performance and preference. However, a meaningful number of data points in the upper left and lower right quadrants highlight instances where users either liked a design but performed poorly or performed well but did not like the design.
The key takeaway for user interface design is that:
- While preference for a design is correlated with performance, it is not a causal relationship. Therefore, user preference alone is not a reliable indicator of performance.
- These are two separate metrics, and both should be considered when evaluating and testing UI designs.
The Learning Environment Design Paradox
The performance vs. preference gap is not limited to user interfaces; it also applies to the design of learning environments. This paradox significantly impacts training programs, educational curricula, and medical simulations, where effective learning is crucial. Often, the training methods that learners find more enjoyable and perceive as effective are not necessarily the ones that lead to superior long-term performance.
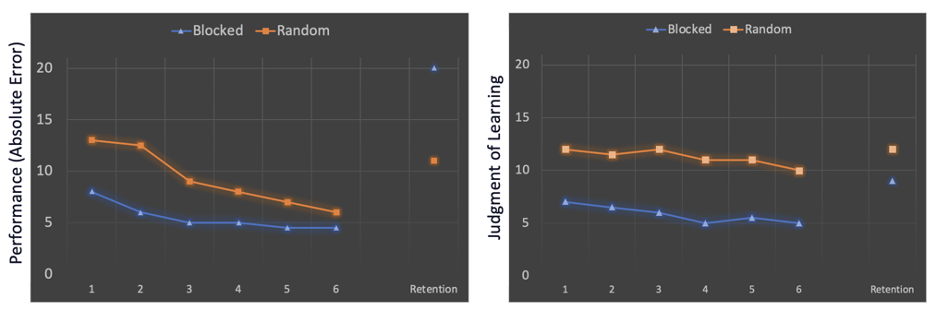
One of the key examples of this paradox is found in motor learning research. Specifically, the study explored blocked vs. random practice designs (Bjork & Simon, 2001):
- Blocked practice involves practicing a single skill repeatedly before moving on to the next. Learners often prefer this approach because it feels more structured, leads to rapid improvements during practice, and users think they are learning faster.
- Random practice, on the other hand, involves mixing different skills during a single session. While this may feel more challenging, less comfortable, and feels like it leads to slower learning, it results in significantly better long-term retention and transfer of skills.
The figure from their study illustrates that learners who experienced random practice performed better in retention tests compared to those who followed blocked practice, even though they preferred blocked practice during training. Importantly, learners believed they would learn more effectively through blocked practice. If decisions were based solely on learner preference or self-reported assessments, they would have chosen the less effective practice method. This is a clear example of how subjective feelings can differ significantly from actual performance outcomes.
The key takeaway for learning environment design is that:
- How users feel they are learning is not an adequate predictor of how they are actually learning, as measured behaviorally (performance).
- Balancing preference for a learning environment with objective assessments of performance is essential for long-term engagement and maximizing learning outcomes.
Conclusion
The performance vs. preference paradox affects both user interface design and learning environments, revealing that user satisfaction does not always align with effective performance outcomes.
In interface design, users may gravitate toward familiar or visually appealing designs that hinder their efficiency. Studies like those by Nielsen and Levy (1994) and the Nielsen Norman Group (2012) demonstrate that user preference is often correlated with performance but is not a reliable indicator. Instead, users sometimes favor designs that feel more familiar or comfortable, even if they lead to worse performance outcomes.
Similarly, in learning environments, learners often prefer training methods that feel easier. However, research by Bjork and Simon (2001) shows that blocked practice, though more comfortable, results in worse long-term retention. Relying solely on learner preferences can lead to training programs that are engaging but ultimately ineffective for skill development.
The key takeaway is that preference and performance are separate metrics that must both be considered during the design process. While self-reported usability assessments are valuable, it is crucial to assess actual performance outcomes to ensure designs are effective.
Balancing preference with measurable performance outcomes will help ensure that users not only enjoy the user interface or learning environment but also use it effectively to achieve their goals.
TL;DR
What You Need to Know:
- Users often prefer designs and learning methods that feel comfortable but perform worse than alternatives
- There’s a positive but imperfect correlation between preference and performance
- This applies to both user interfaces and learning environments
Why It Matters:
- Relying solely on user preferences can lead to suboptimal design decisions
- Making decisions based purely on what users say they want, rather than how they perform, can harm productivity and learning outcomes
Action Items:
- Do:
- Measure both preference AND performance when evaluating designs
- Consider implementing evidence-based design choices even if they initially face resistance
- Balance user satisfaction with measurable outcomes
- Don’t:
- Rely exclusively on user feedback or satisfaction surveys
- Assume that what users prefer is what will help them perform best
- Sacrifice long-term effectiveness for short-term comfort
For more resources on Medical Device Human Factors please check out our blog and YouTube channel.